Track Hawaii Island vog using these helpful websites
How to monitor the Big Island's vog situation created by the Kilauea eruptions.
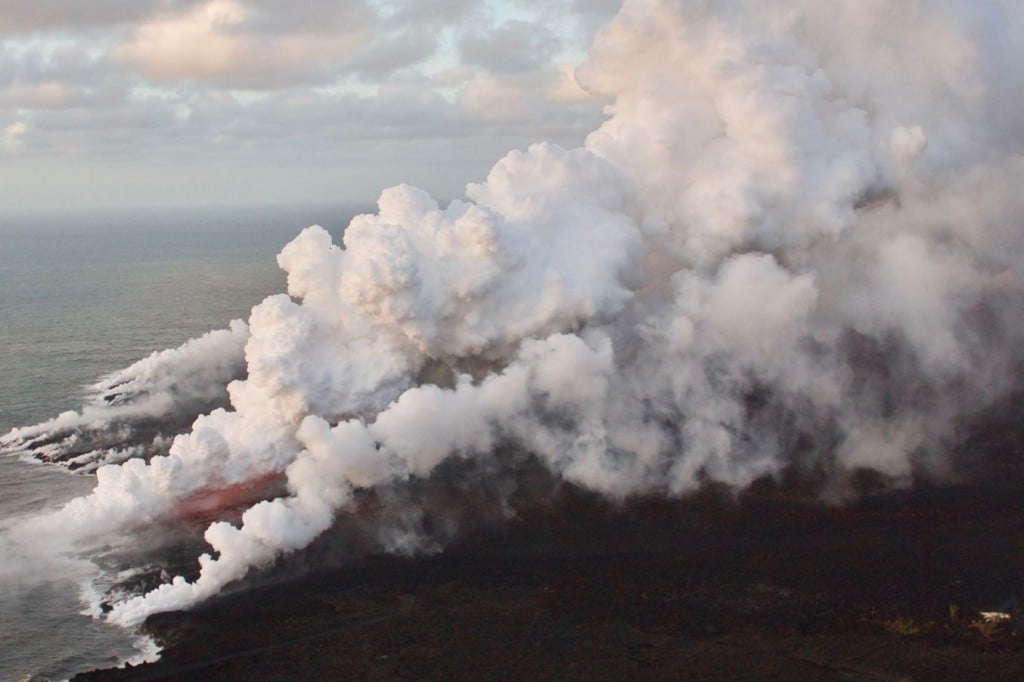
With the ongoing eruptions occurring on the Island of Hawaii, specifically in the Puna district, a large quantity of vog, hazy air pollution created by volcanic activity, is being produced on the Big Island. While mostly harmless, it can cause respiratory problems, headaches and watery eyes if there’s a high concentration of vog in the area.

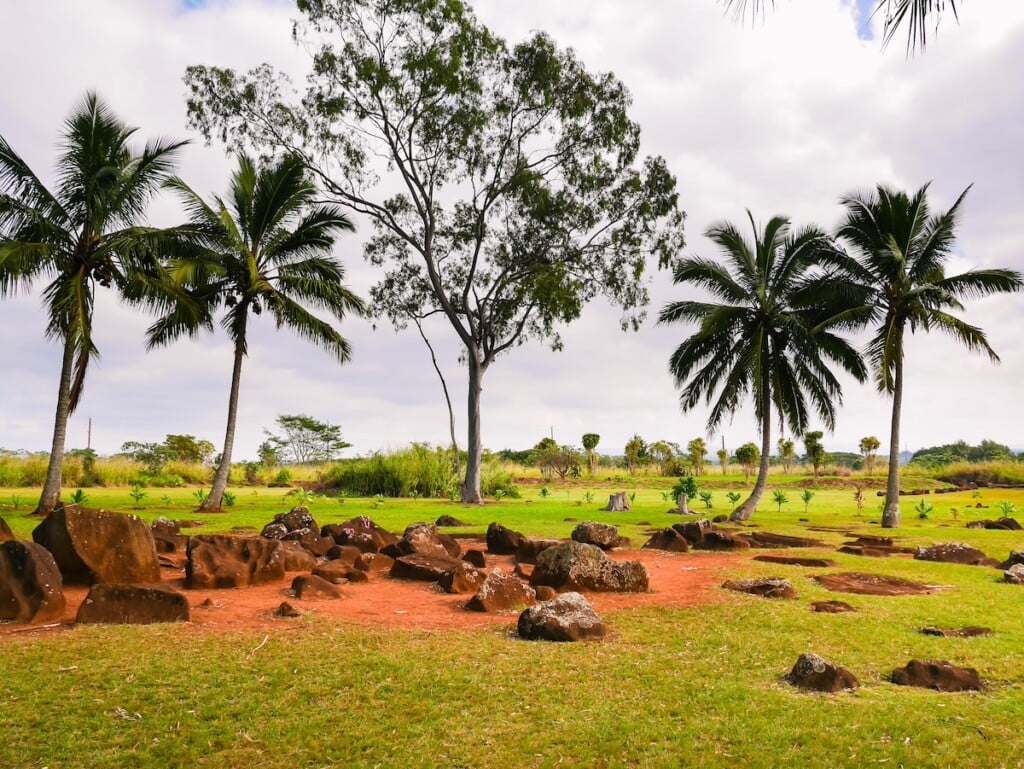
Photo by Kevin Allen
Fortunately, the Hawaii County Civil Defense Agency, Hawaii State Department of Health, and the U.S. Environmental Protection Agency (EPA) all teamed up to create this air monitoring viewer on the EPA’s website. The map of the Big Island shows numerous air monitoring data points across the island and gives them a color code based on their concentration of vog. Air pollution in the areas are rated from light (blue), moderate (orange) and red (heavy), with conditions being updated every 30 minutes. Another helpful aspect of the site is that it allows users to view health effects associated with each color.

Photo by Kevin Allen
For those looking for a more visual tool, this global map of wind conditions can also be used to track the direction of vog. Not only will this map show the direction of the wind, which can affect the direction vog is headed, but if users click on the “earth” button in the bottom left-hand corner of the screen and select SO4ex on the overlay tab, they will be able to see a representation of the volcanic air. Unfortunately, the site is only updated every three hours and isn’t as accurate as the EPA tracker.
Additional information about the ongoing eruptions at Kilauea can be found here.